Developing an experimental system for image generation
Intro
While working in the field of image generation, I encountered a frustrating issue: “How can I easily find the optimal parameters for the model I’m using?”
Given the inherent randomness in image generation, it’s challenging to consistently produce desired images. However, I believe that to create a useful service, we need to be able to consistently produce images that meet a certain quality threshold.
To achieve this, I needed to identify which parameters have the most significant impact on performance, based on factual evidence. However, after searching through various communities for methods to find optimal parameters, I couldn’t find a clear solution.
Many people share impressive images they’ve generated in online communities like CivitAI and Reddit, but these are often either lucky outcomes or images created by experienced individuals in the field. While the model, prompt, and parameters used to generate these images are often shared, they can’t be universally applied to all situations, making it difficult to generalize.
In other words, image generation results still largely depend on experience, and there’s a lack of data-based explanations for why certain results are produced.
Therefore, I wanted to create a tool that could automate image generation, accumulate data, and analyze how images change under different conditions (parameters), and in which cases the results are good or bad.
How?
In deep learning, there’s a term called hyperparameters. These are top-level parameters (such as epoch, learning rate, batch size, optimizer) that significantly influence the model’s learning process. The act of finding the optimal hyperparameter values is called “hyperparameter tuning.”
There are many libraries created for hyperparameter tuning (Ray Tune, Optuna, W&B Sweep, etc.). However, what I wanted to do was not adjust hyperparameters for training, but rather ‘compare results based on parameter changes.’
Since the results in question are generated images, I needed to be able to easily view images that match specific parameter conditions together. To solve this, I considered two approaches:
- Experiment with parameters using W&B’s sweep feature and send images to W&B’s managed cloud for analysis on the W&B dashboard
- Pros
- Easy implementation with a single library
- Dashboard provided
- Cons
- Cost (not open source)
- Slow rendering speed for larger images, causing inconvenience
- Pros
- Use MLflow’s optuna integration to experiment with parameters, build an MLflow tracking server to manage artifacts and logs, and develop a separate image viewer UI
- Pros
- Low cost (open source)
- Custom UI
- Cons
- Slightly complex architecture setup
- Requires custom UI development
- Pros
Ultimately, I chose option 2. It allows for cost-effective operation and the ability to customize the UI according to my desired image generation workflow. The architecture for option 2 is as follows:
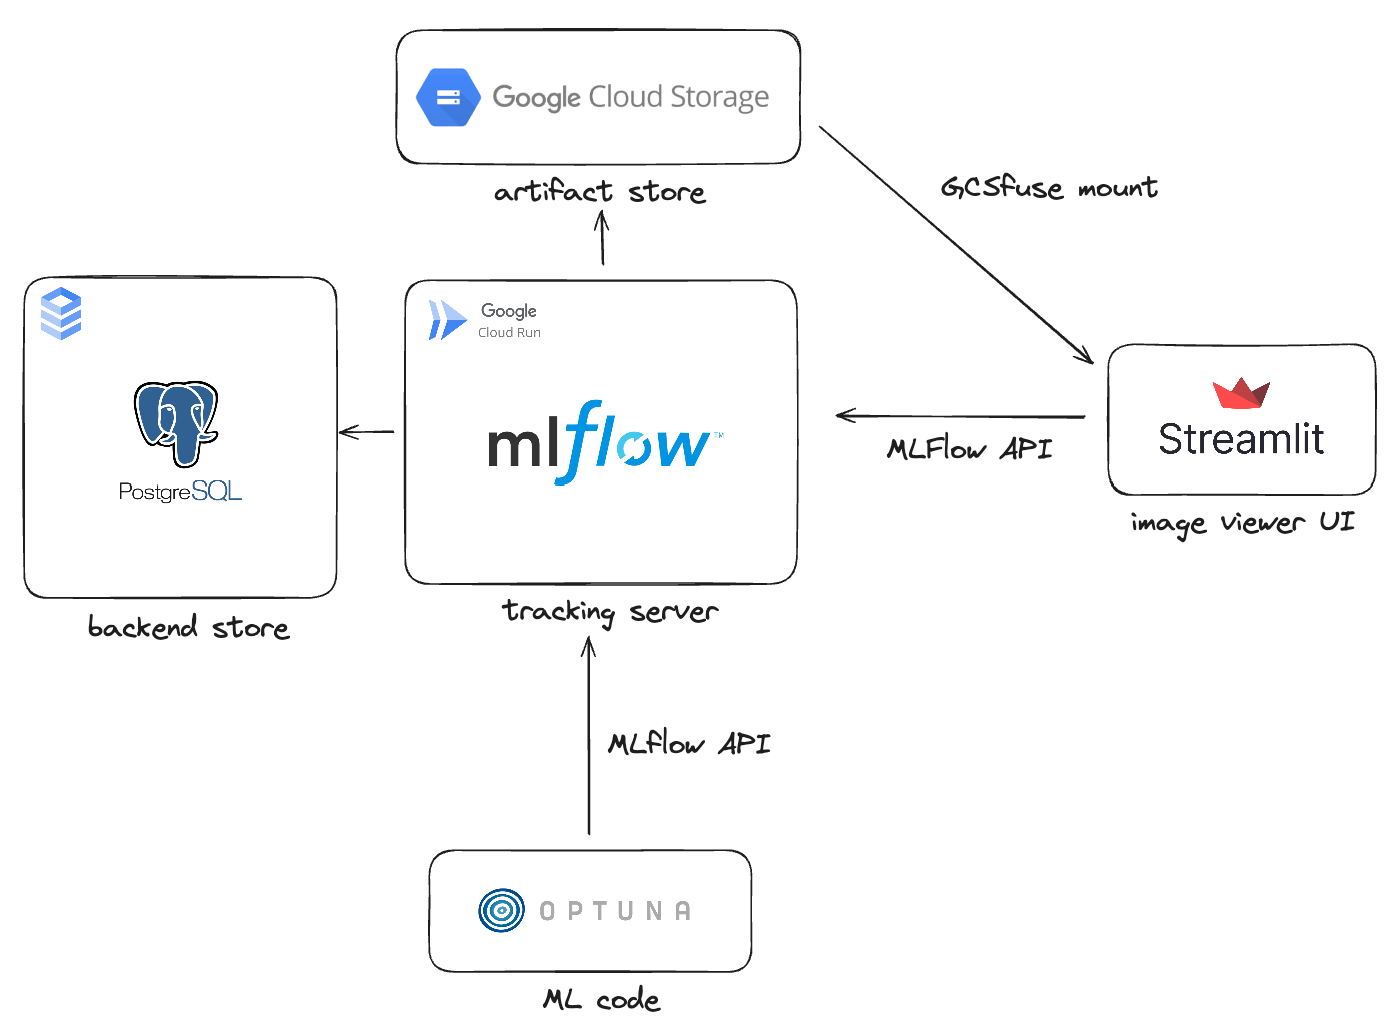
Typically, when using an MLflow tracking server, hyperparameters and metric values are stored in the backend store, while model files are stored in the artifact store.
However, I used the backend store to save parameters that influence the image generation inference process and the artifact store to save the generated images.
The MLflow tracking server can be simply installed on an instance for use, or it can be safely operated in a Kubernetes environment like GKE.
However, we need to consider the cost. As it’s literally a “server,” it requires computing resources, and in a cloud environment, you’re billed for what you use.
But do we really need to keep a server running continuously for parameter experiments when we only need it occasionally? I didn’t think so, which is why I chose Cloud Run to operate the MLflow tracking server in a serverless manner.
Cloud Run is one of GCP’s services that allows you to deploy by running container images in a serverless manner. Similarly, I used GCP’s SQL and GCS (Google Cloud Storage) services for the backend store and artifact store, respectively.
Now, let’s build the environment step by step.
Setting Up MLflow on GCP
Prerequisite
- Clone Github Repository
- GCP Account
- GCP CLI
- Docker Environment
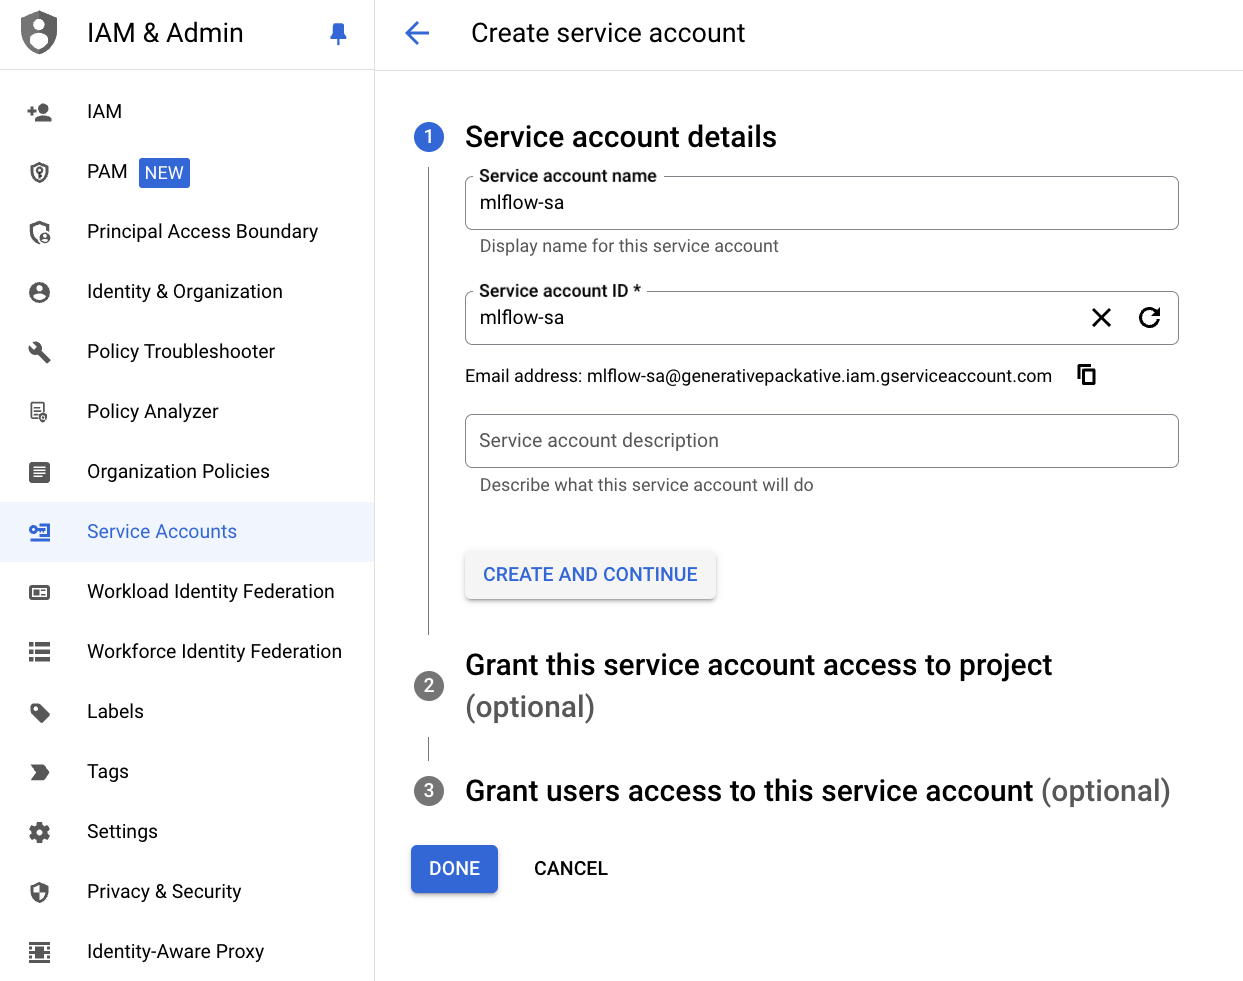
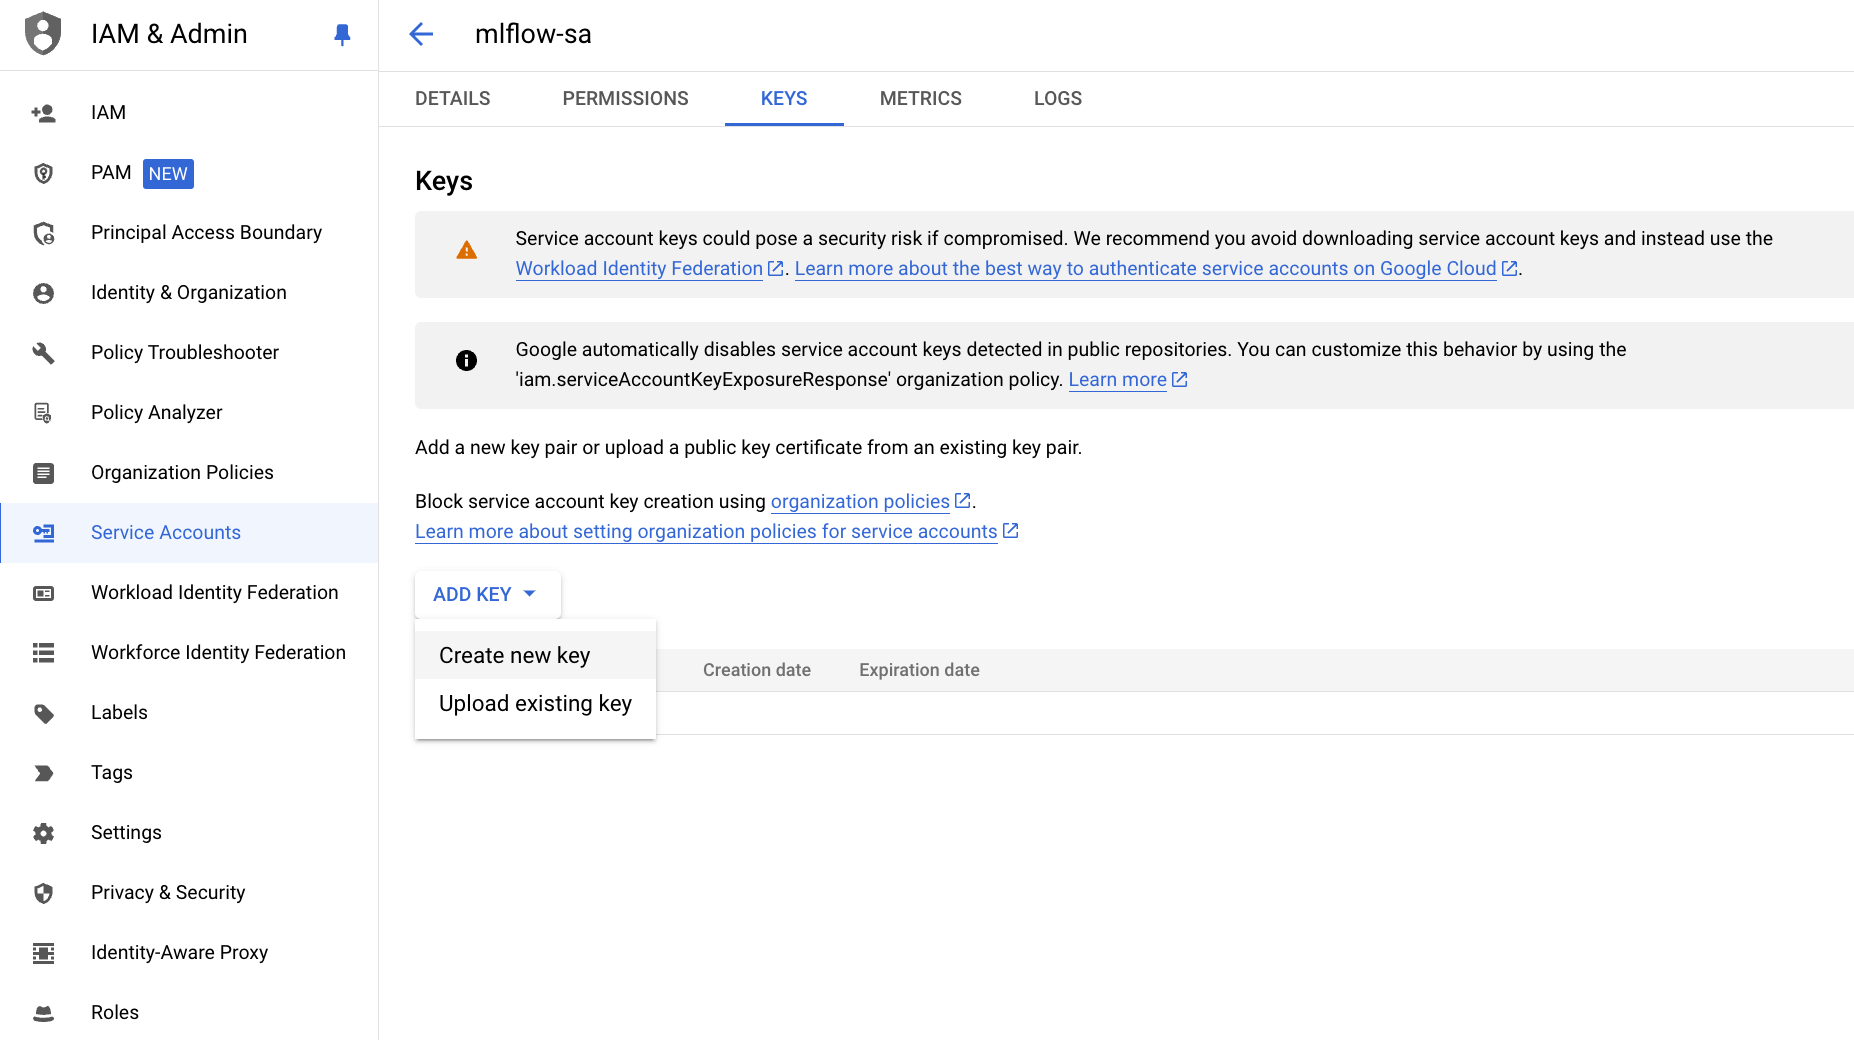
1. Create Service Account
For the image generation ML code or Image Viewer client to communicate with GCP services, you need a key pair of a Service Account that has the role to access those services.
-
IAM & Admin -> Sevice Accounts -> Create Service Account
-
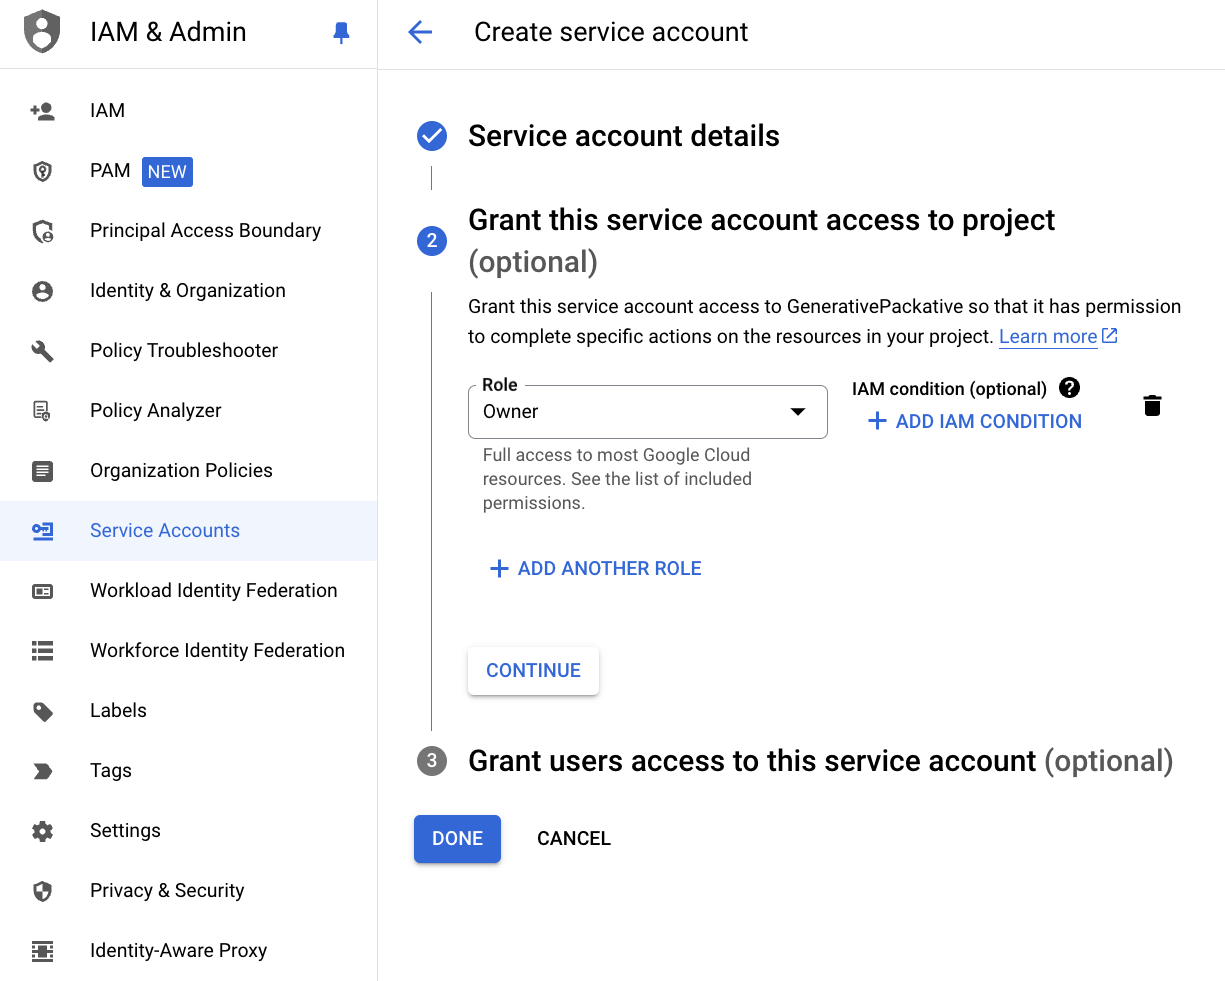
Assign roles to the Service Account (we’re setting it as Owner here, but it’s recommended to modify it later according to your desired permissions)
-
Generate Json key pair
-
Save the key pair
Save the key pair as “credentials.json” and keep it safe. You can only download the key pair once.
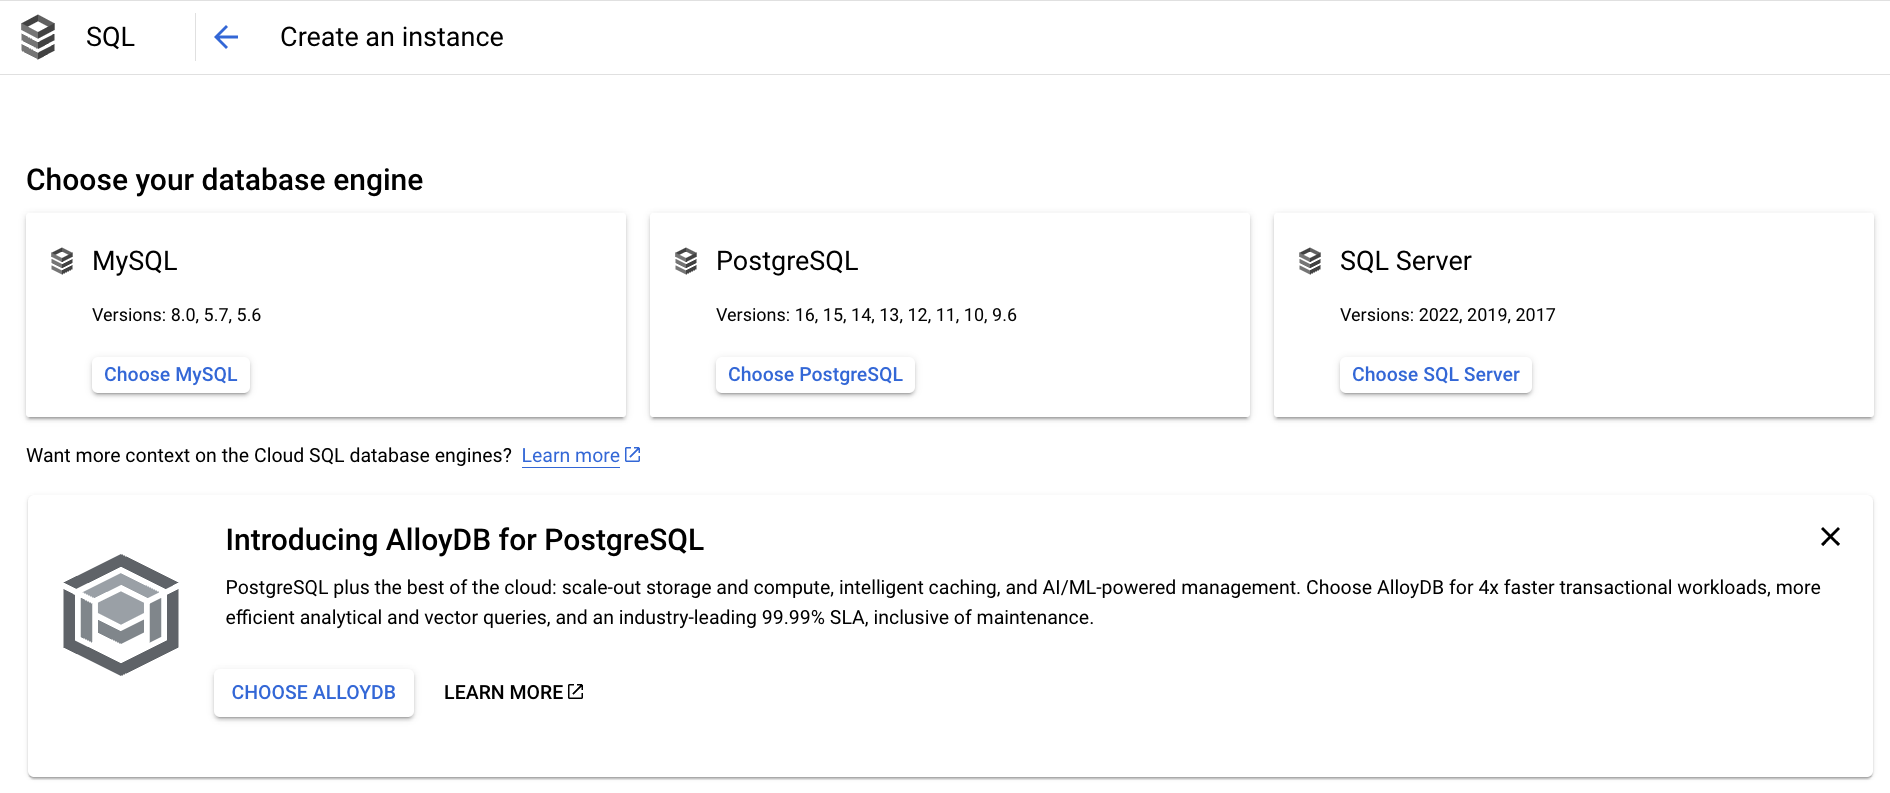
2. Create SQL Database
Create PostgreSQL to be used as the backend store.
-
SQL -> Create Instance -> Select PostgreSQL
-
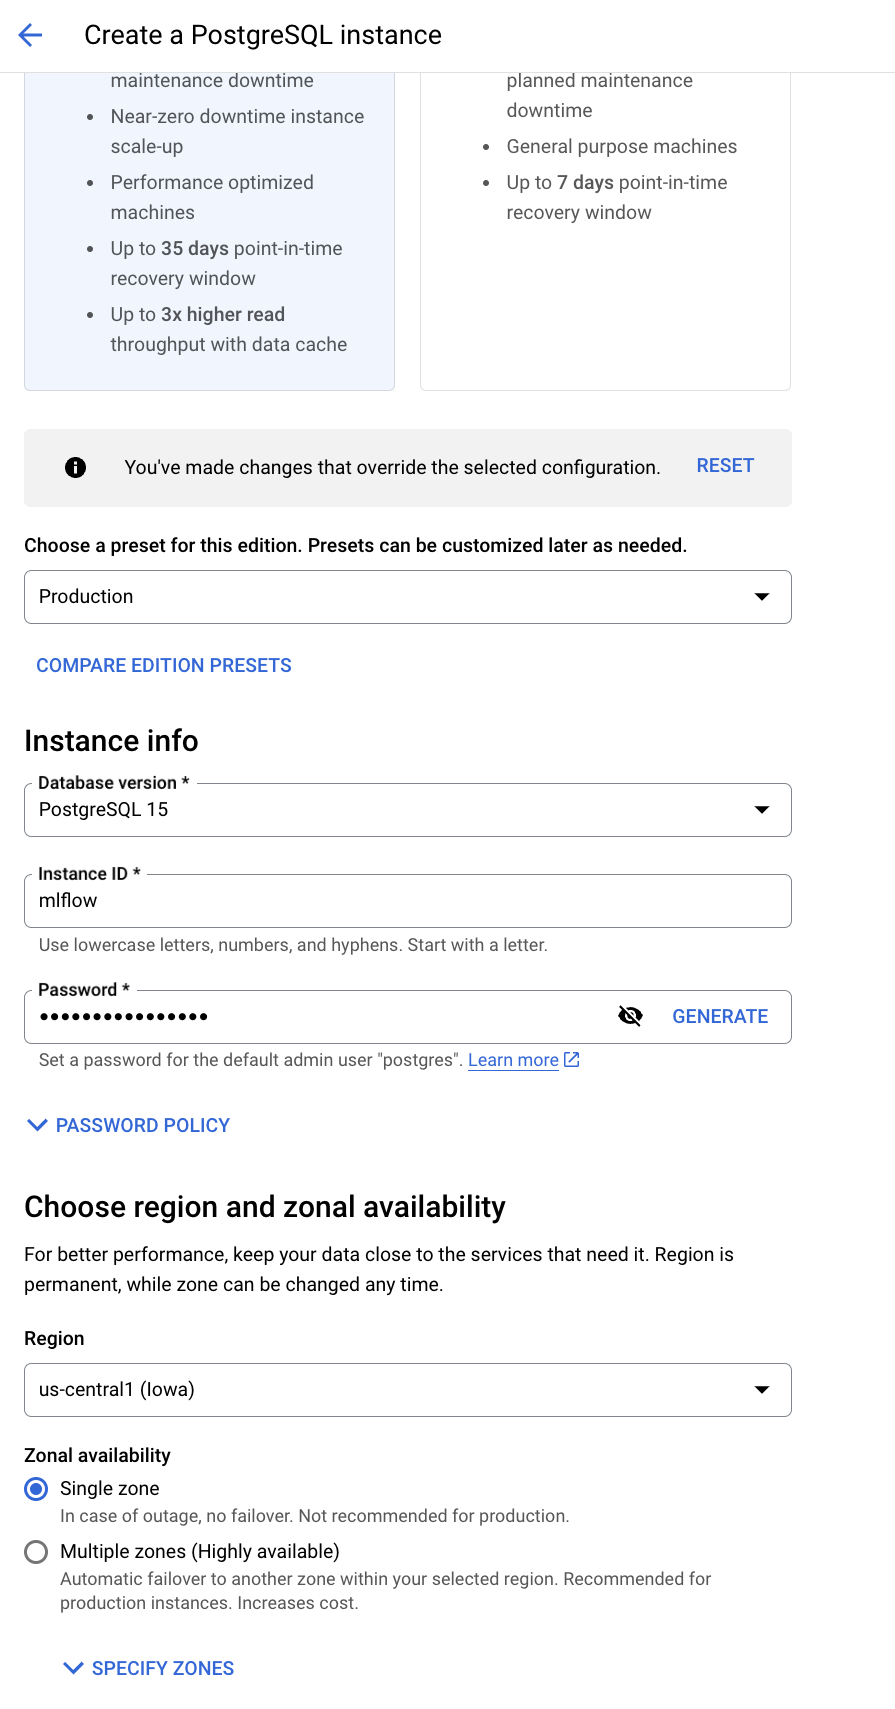
Name your database, and set the default user password and location preferences
-
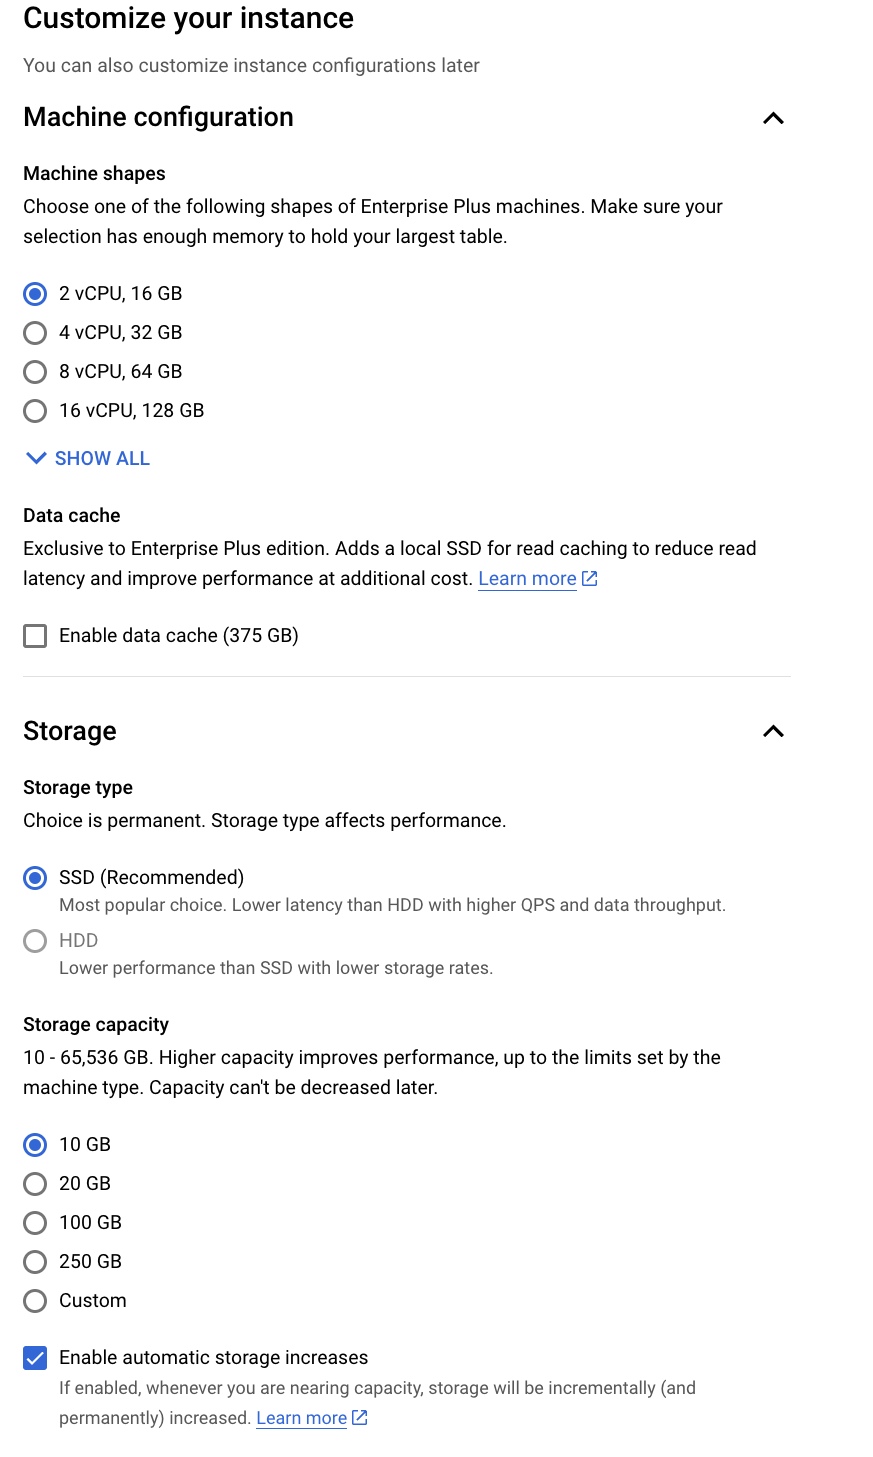
Show Configuration options -> set machine and storage
-
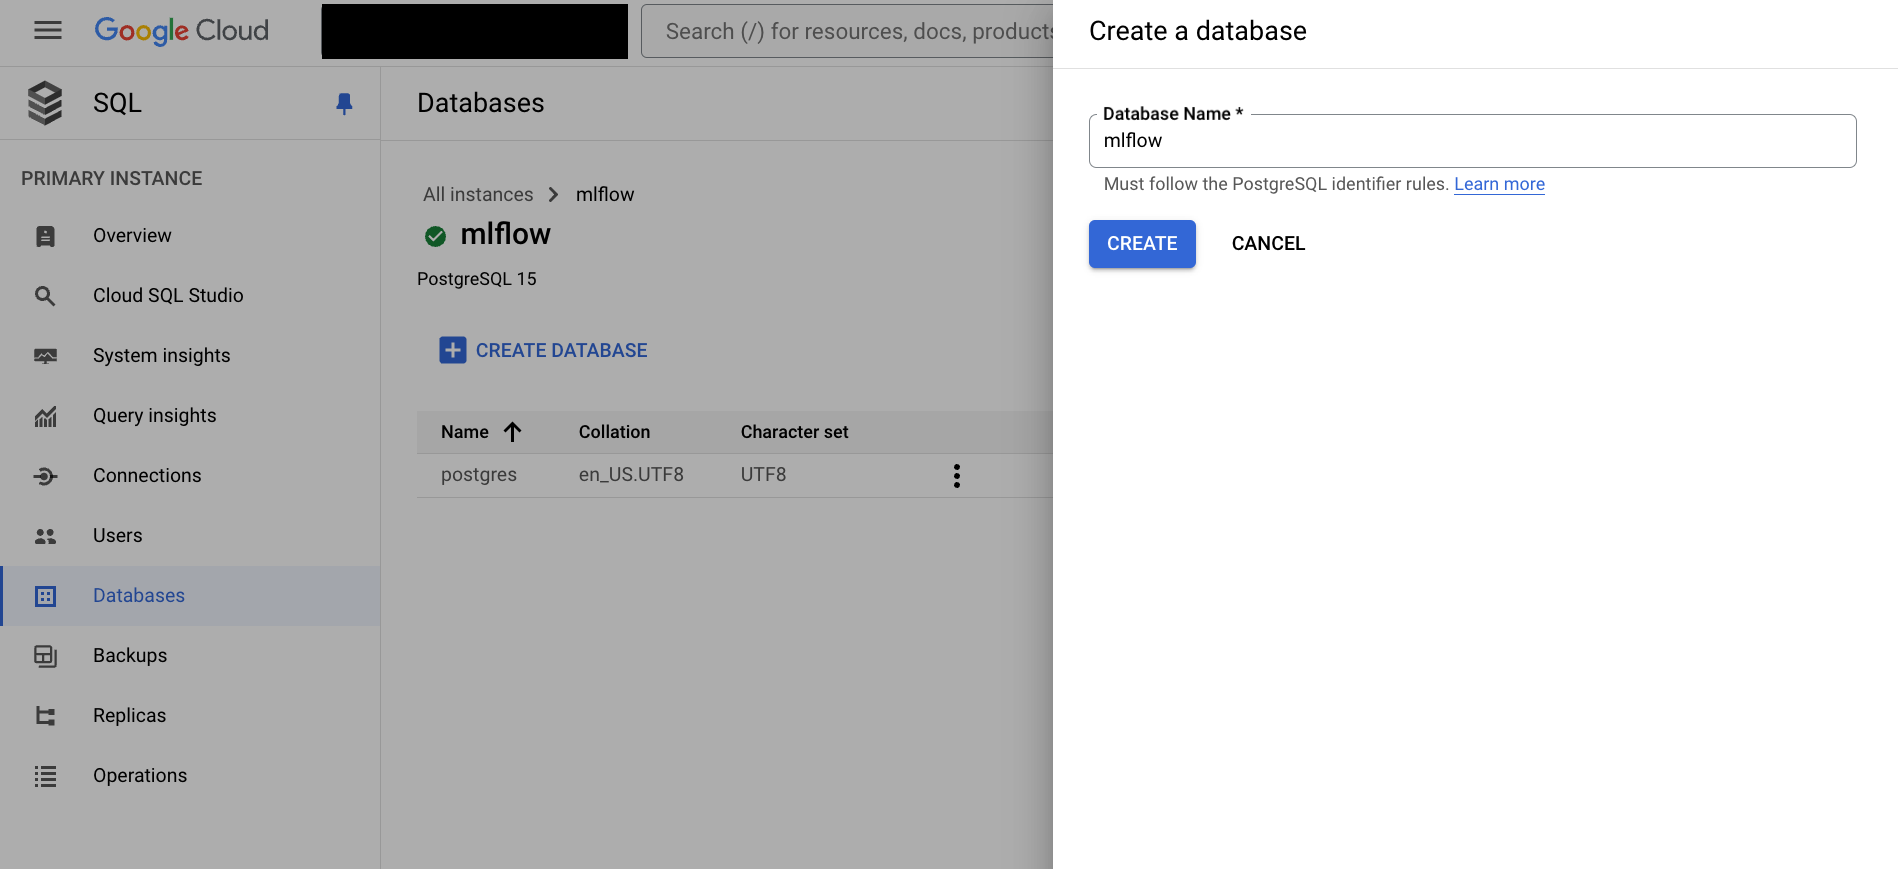
Databases -> Create Database
-
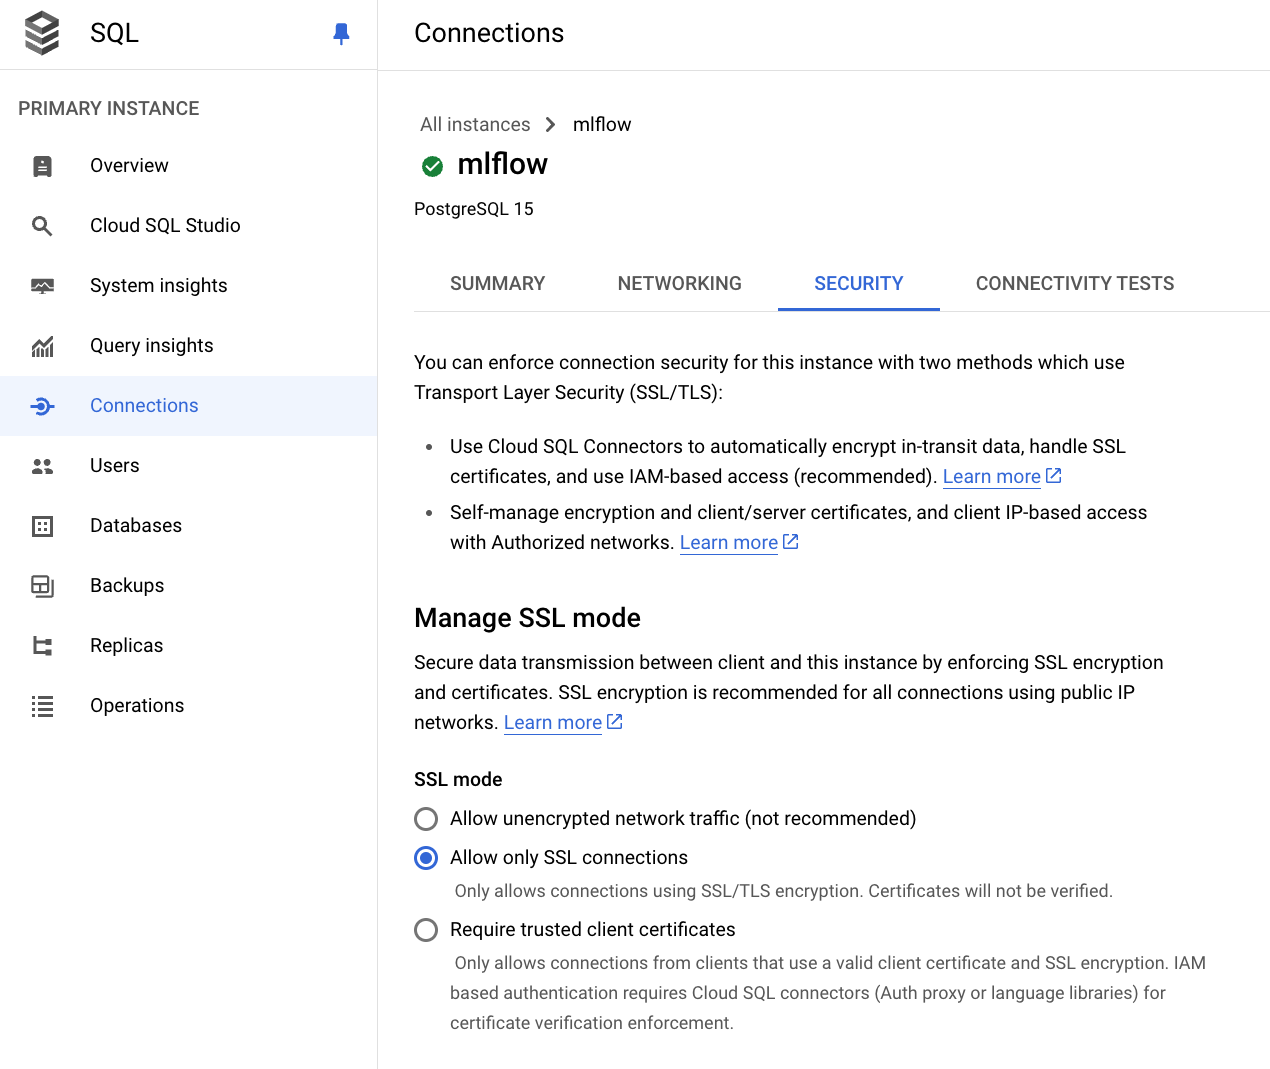
Connections -> Security -> Allow only SSL connections
-
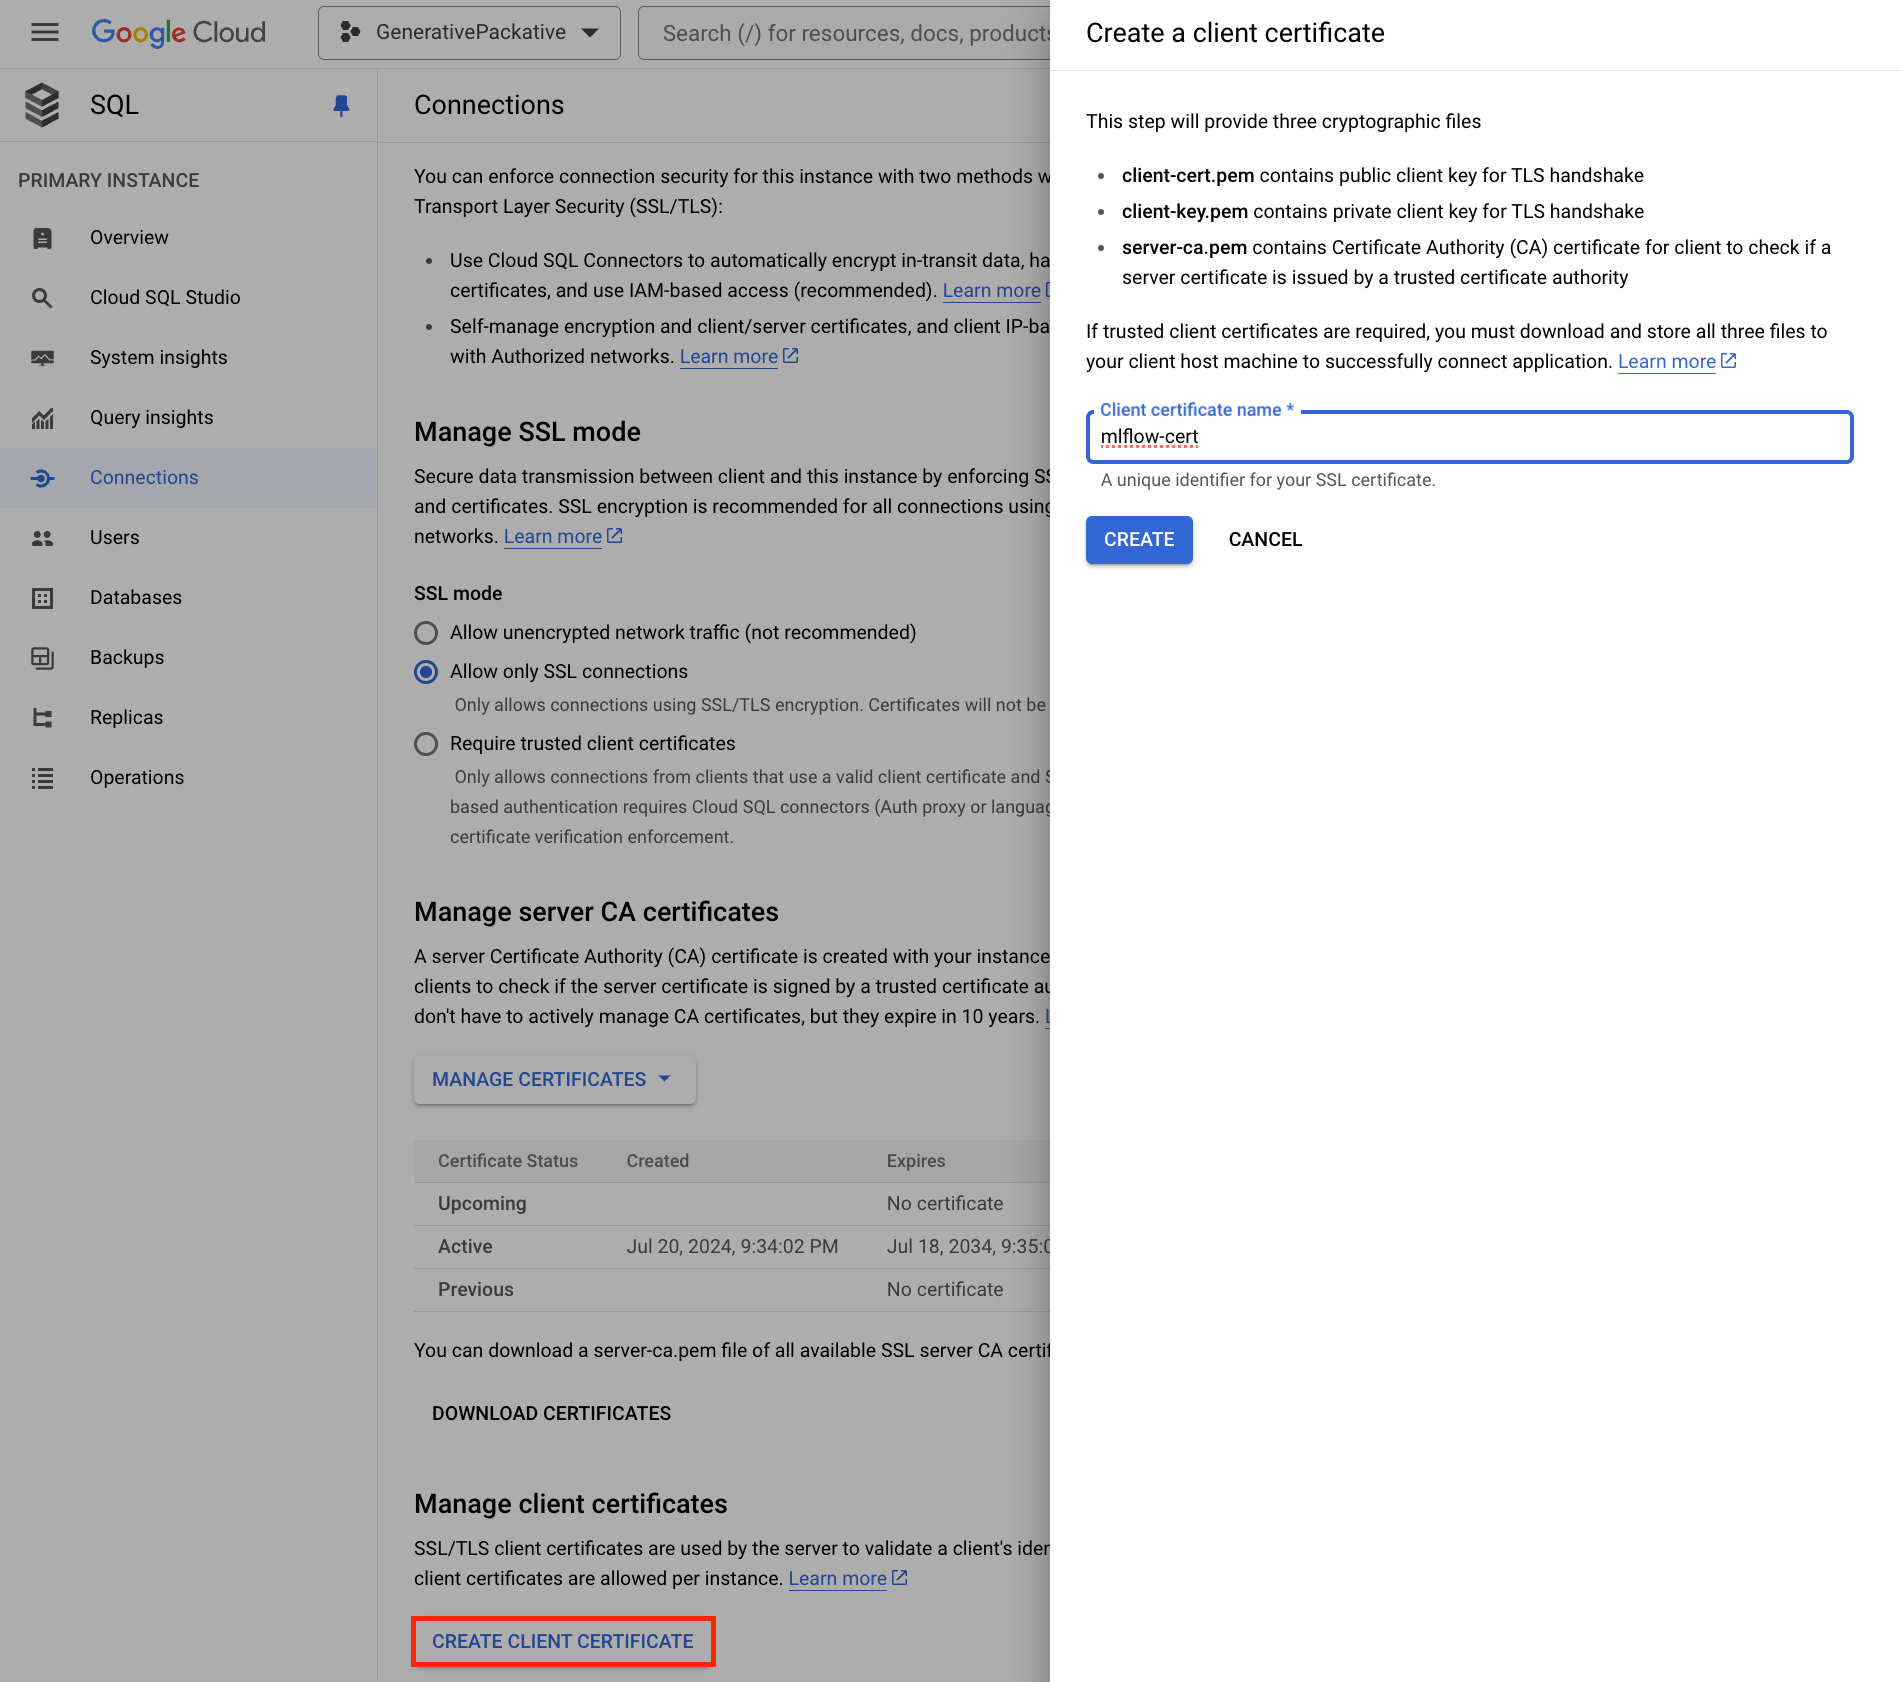
Connections -> Security -> Click Create Client Certificate
To allow MLflow to connect to your SQL instance, you need to set up an SSL connection. When you create a client certificate, you’ll download three files: client-key.pem, client-cert.pem, and server-ca.pem. Keep these safe.
-
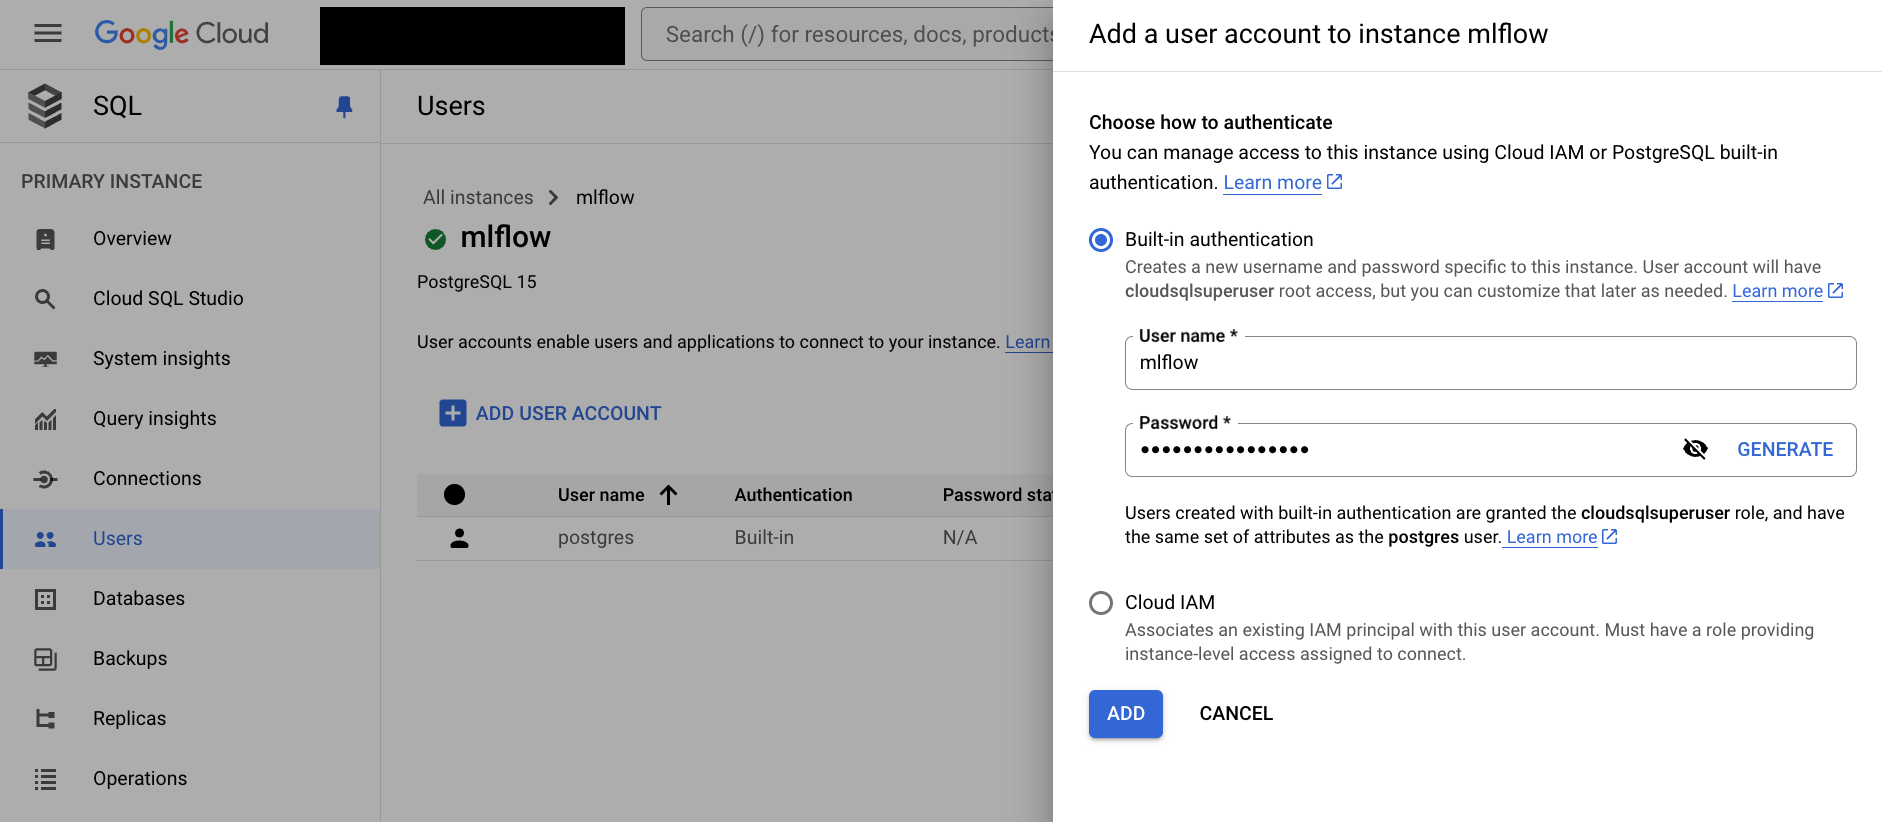
Users -> Add User Account -> ADD
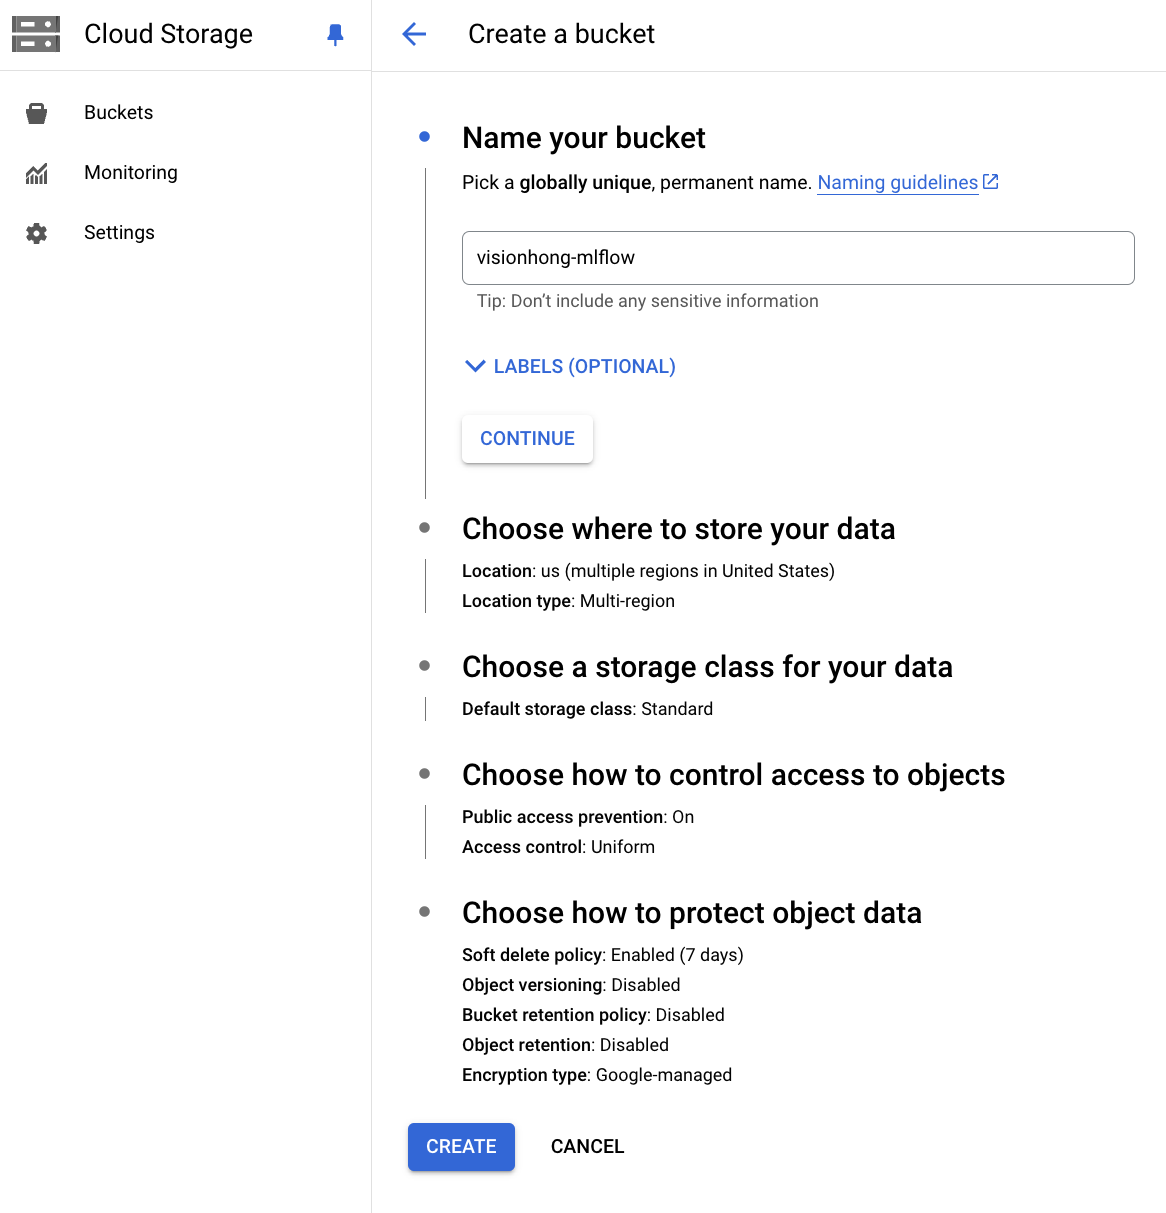
3. Create Google Storage Bucket
Create a GCS bucket to be used as the artifact store.
-
Cloud Storage -> Buckets -> Create
4. Secret Manager
The MLflow Tracking server requires several environment variables to be set, such as the URIs for the backend store and artifact store. Since we’re building everything in the GCP environment, we’ll store these environment variables in GCP’s Secret Manager and configure the MLflow Tracking Server to use them securely.
-
Secret Manager -> Create Secret
We need four Secrets
- mlflow_artifact_url: gsutil URI(Cloud Storage -> Click MLflow bucket -> Configutation -> gsutil URI 복사)
gs://<bucket name> - mlflow_database_url:
postgresql+psycopg2://<dbuser>:<dbpass>@/<dbname>?host=/cloudsql/<sql instance connection name> - mlflow_tracking_username: your http auth(login) username
- mlflow_tracking_password: your http auth(login) password
- mlflow_artifact_url: gsutil URI(Cloud Storage -> Click MLflow bucket -> Configutation -> gsutil URI 복사)
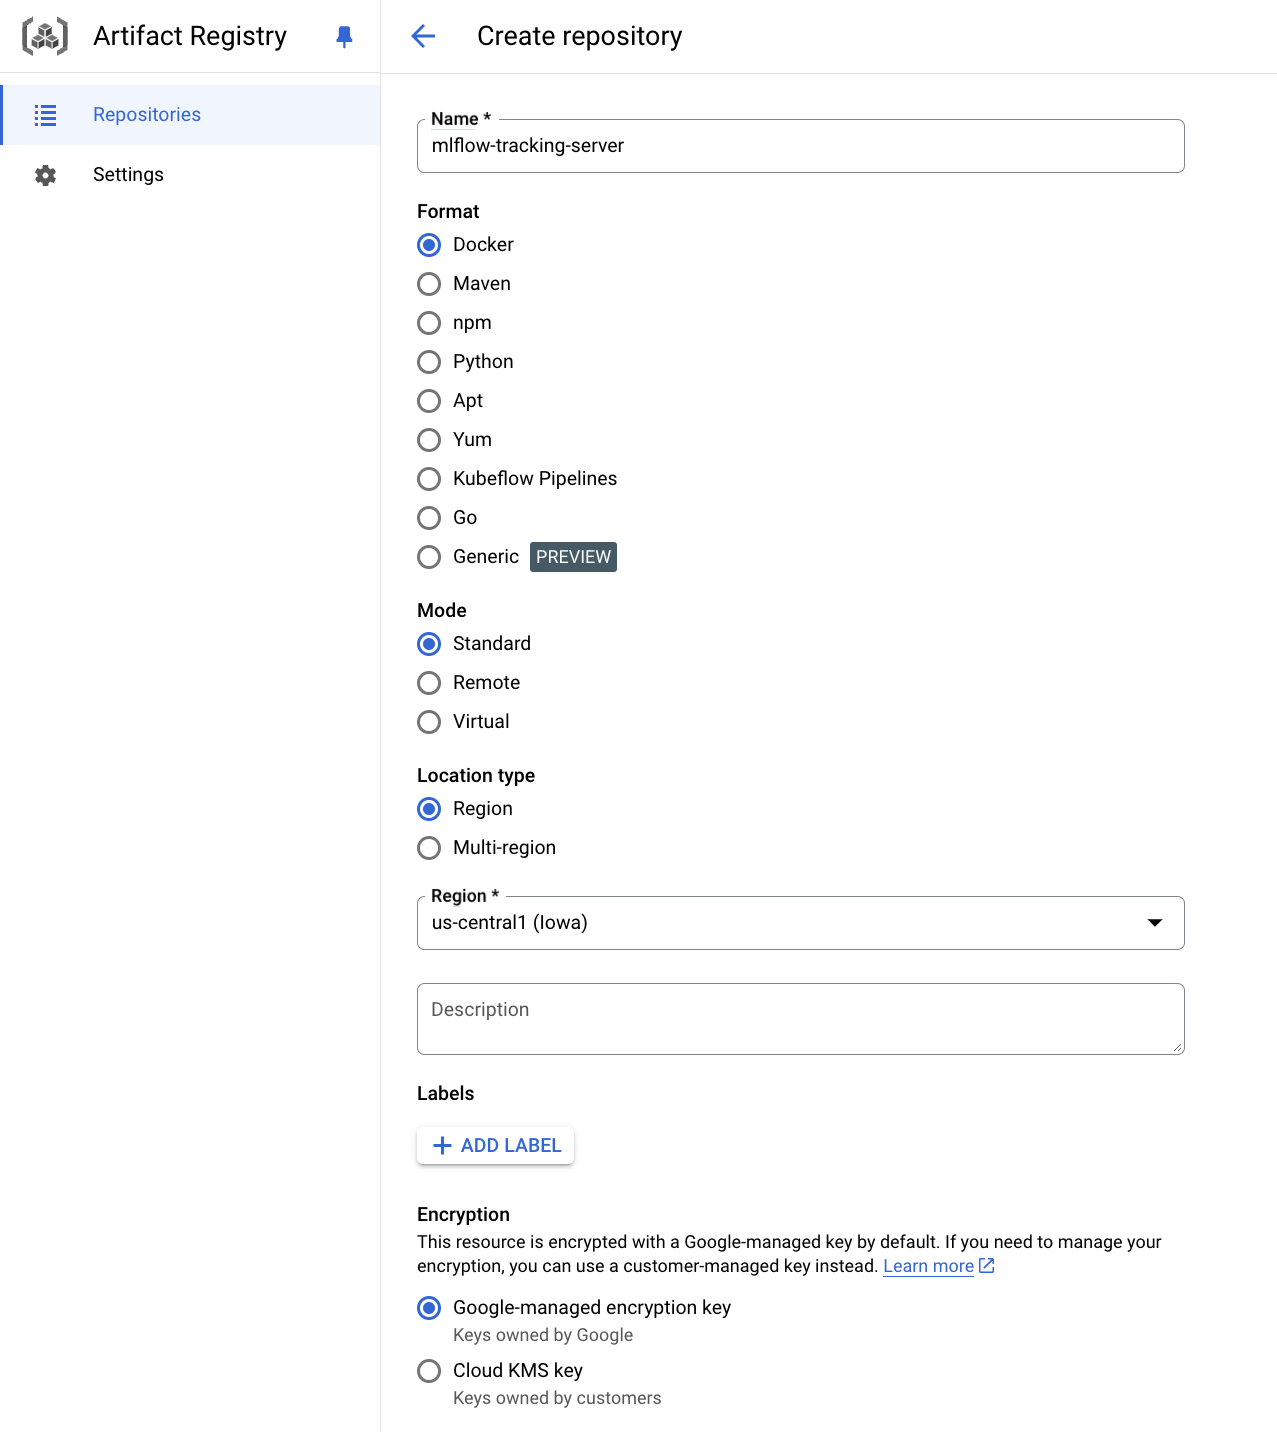
5. Container Registry
Set up the MLflow Tracking Server image to be used in Cloud Run.
-
Create Artifact Registry repo
Artifact Registry -> Create repository
-
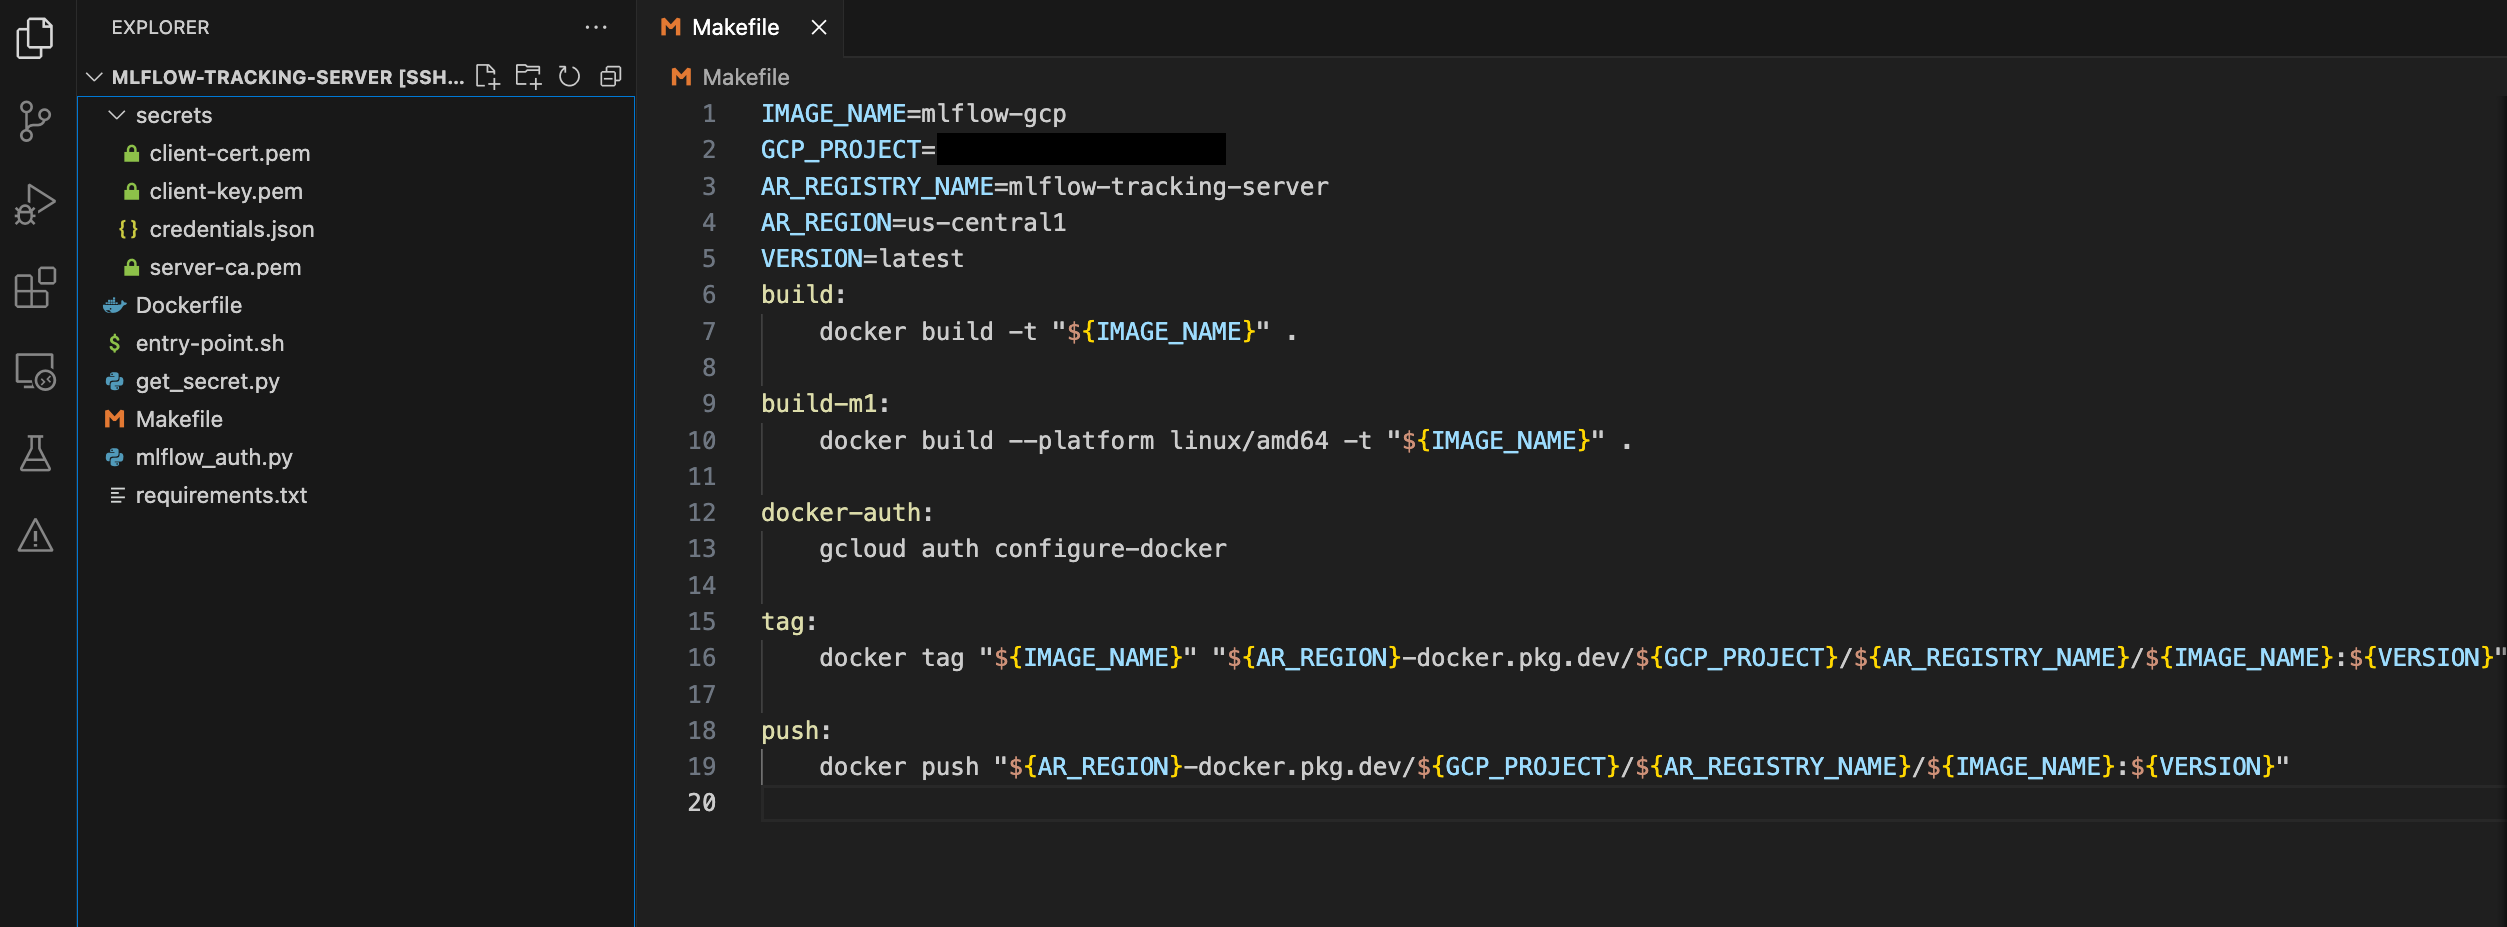
Configure code
Please configure as shown in the image below.
- Create a secrets folder and move the 4 files you’ve downloaded so far
- Modify the environment variables at the top of the Makefile to match your settings. (GCP_PROJECT refers to the project id.)
-
Activate your Google Cloud Service Account (Run in shell)
gcloud auth activate-service-account --key-file="<your_credentials_file_path>" -
Authenticate Artifact Registry
make docker-auth -
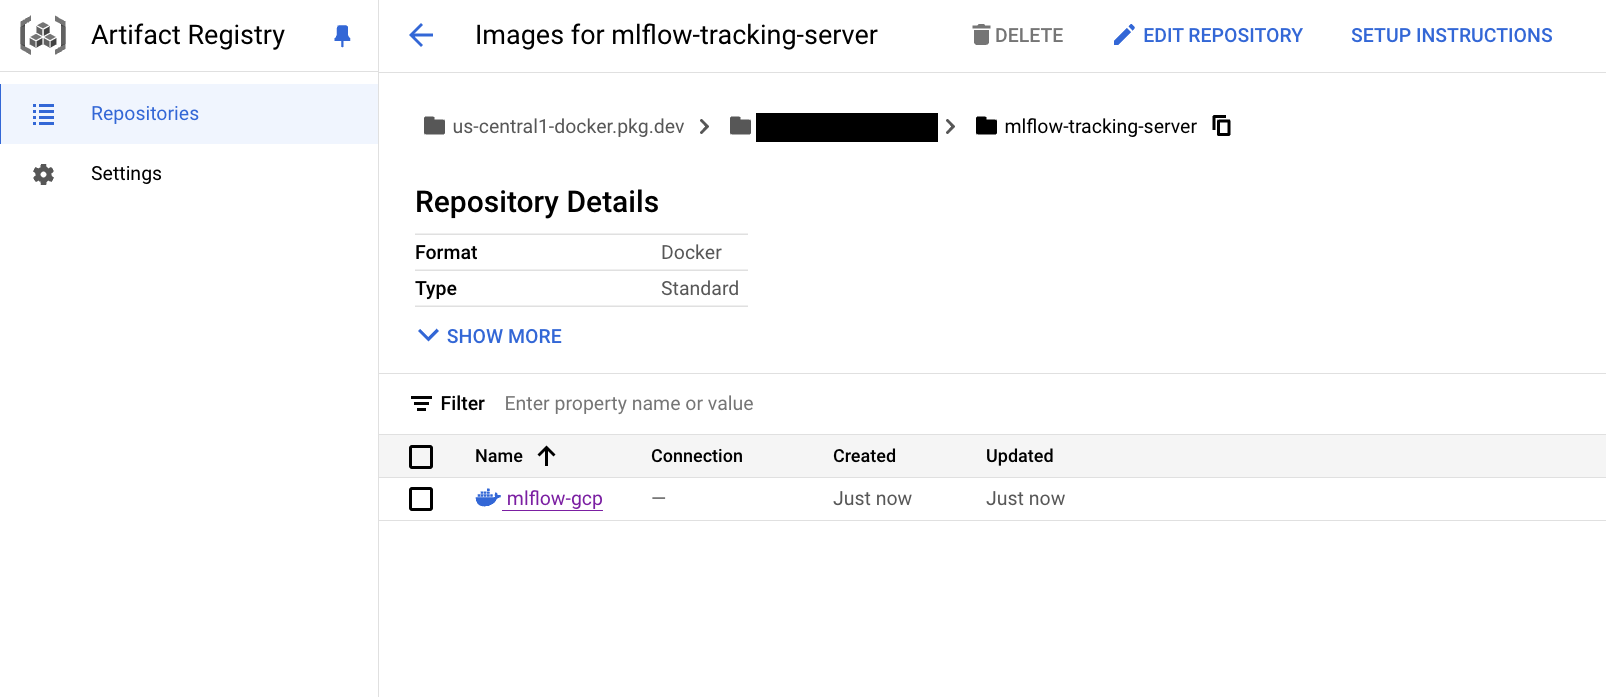
Docker build & push
make build && make tag && make pushCheck if the image is stored in Artifact Registry as shown in the image below
6. Cloud Run
Now all preparations for running the MLflow Tracking Server are complete. Let’s use Cloud Run to run this image.
-
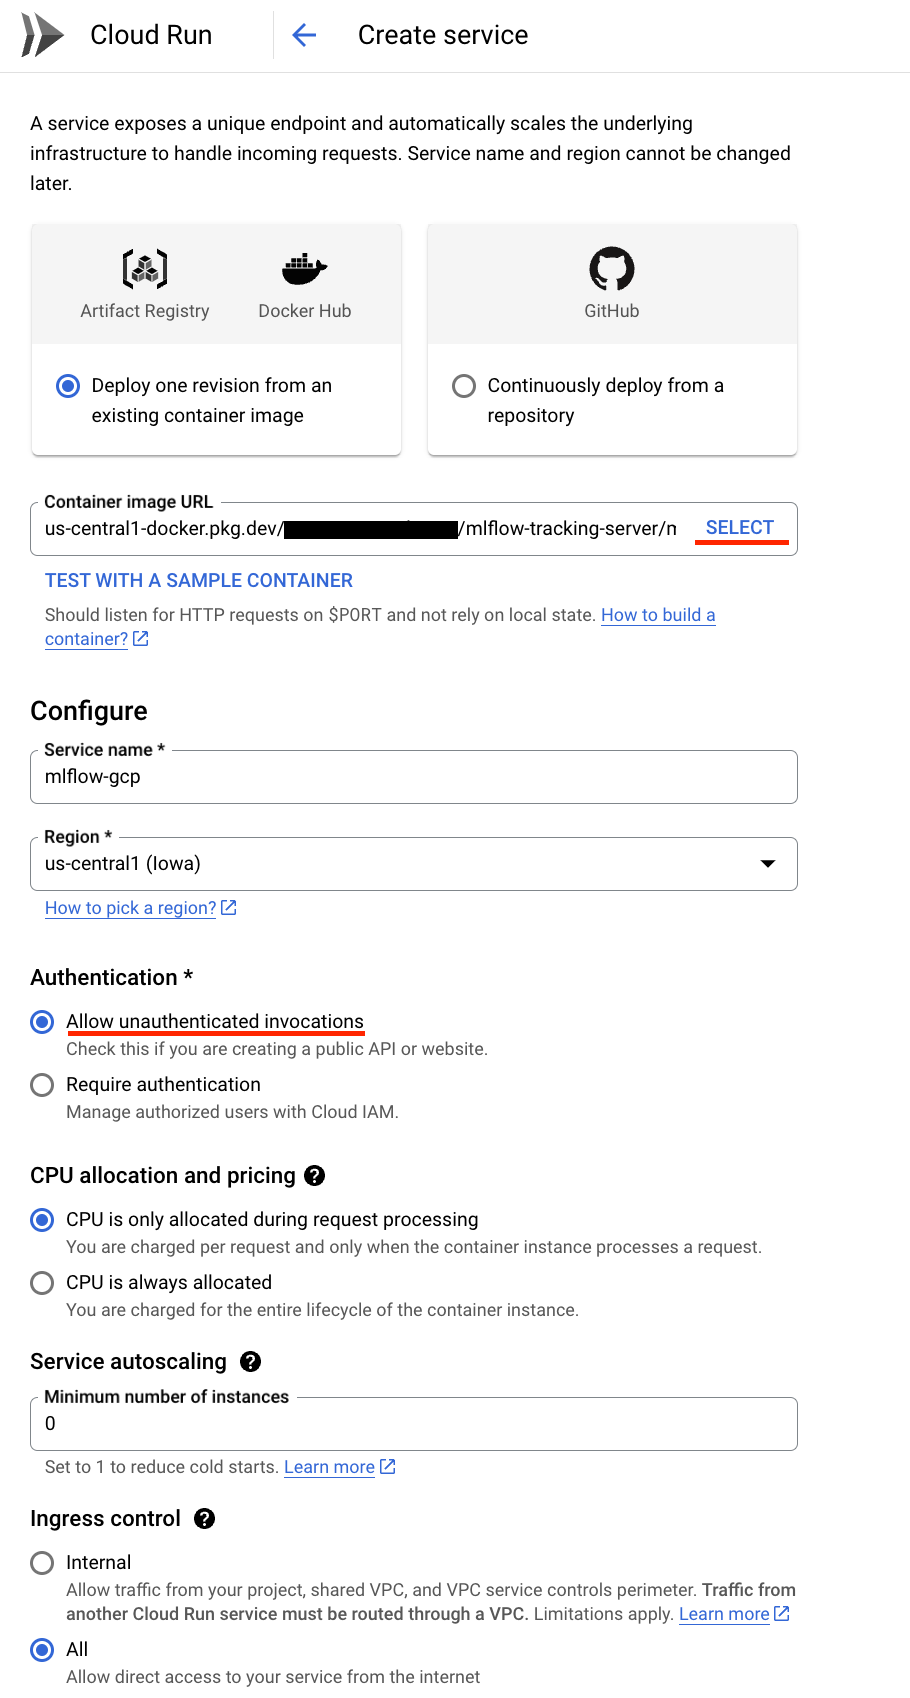
Cloud Run -> Create Service
- Select the image you put in Artifact Registry
- Click Allow unauthenticated invocations (mlflow is protected by HTTP basic authentication)
-
Click Container, Volumes, Networking, Security
- Container -> Settings -> Set Memory 1GB, CPU 2
- Container -> Variables -> Add
GCP_PROJECT : <GCP project id> - Container -> Cloud SQL connections -> Select the SQL instance you created
- Security -> Select the Service Account you created earlier
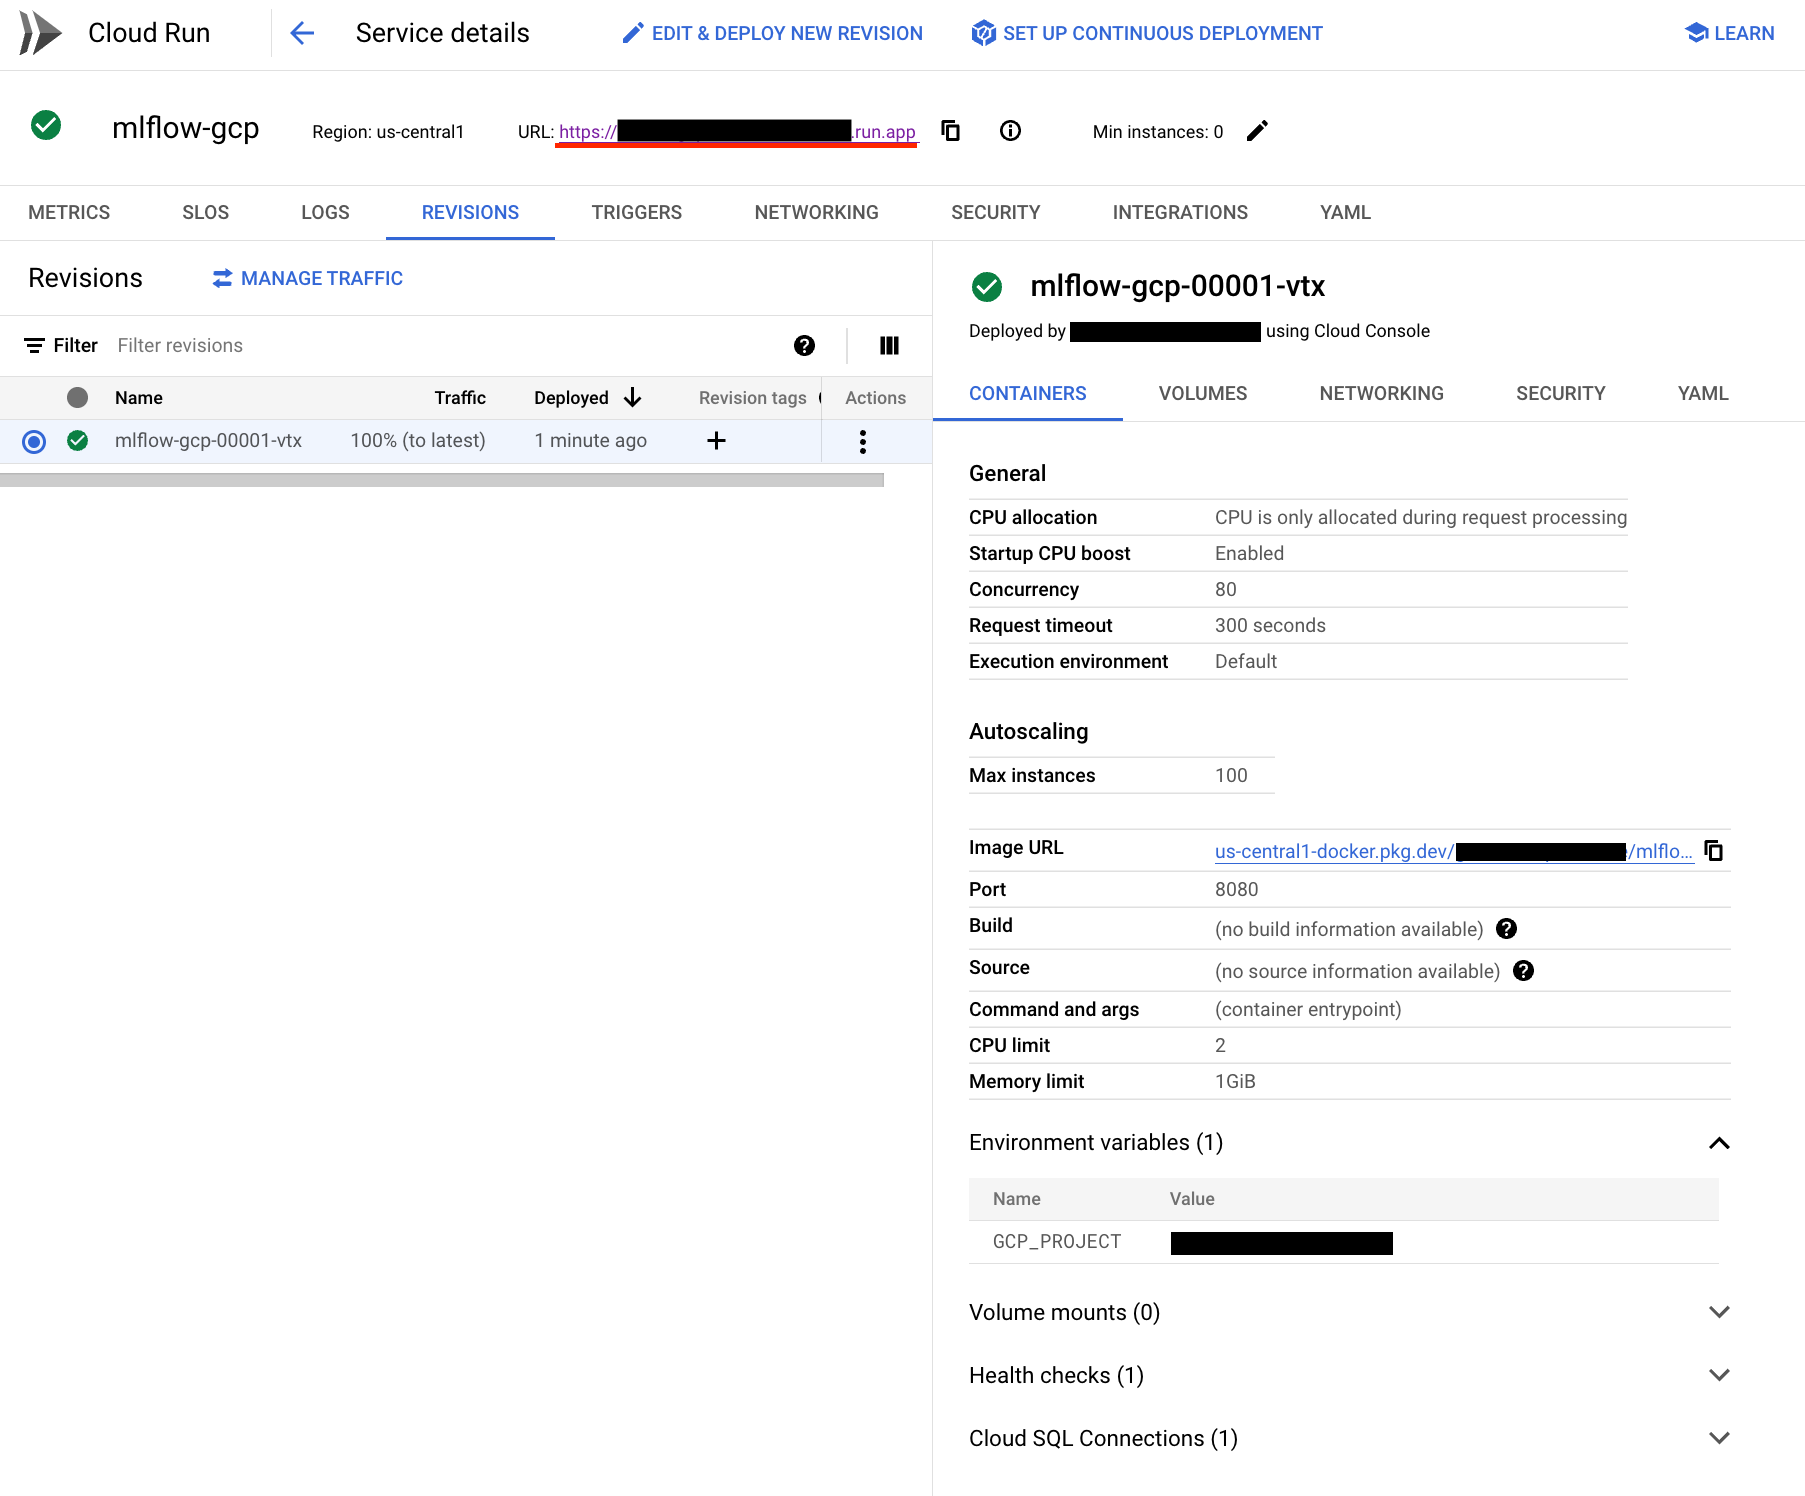
- After configuration, click Create
If the Cloud Run service is created successfully, you’ll see a screen like this:
7.MLflow login
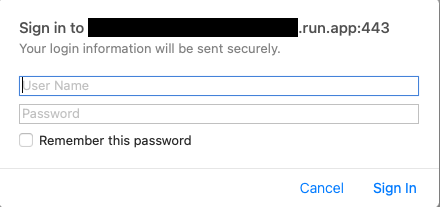
You can access the MLflow dashboard by clicking the URL in the running Cloud Run service.
When you access the URL, you’ll see a login screen like the one below. Enter the mlflow_tracking_username and mlflow_tracking_password you set in Secret Manager.
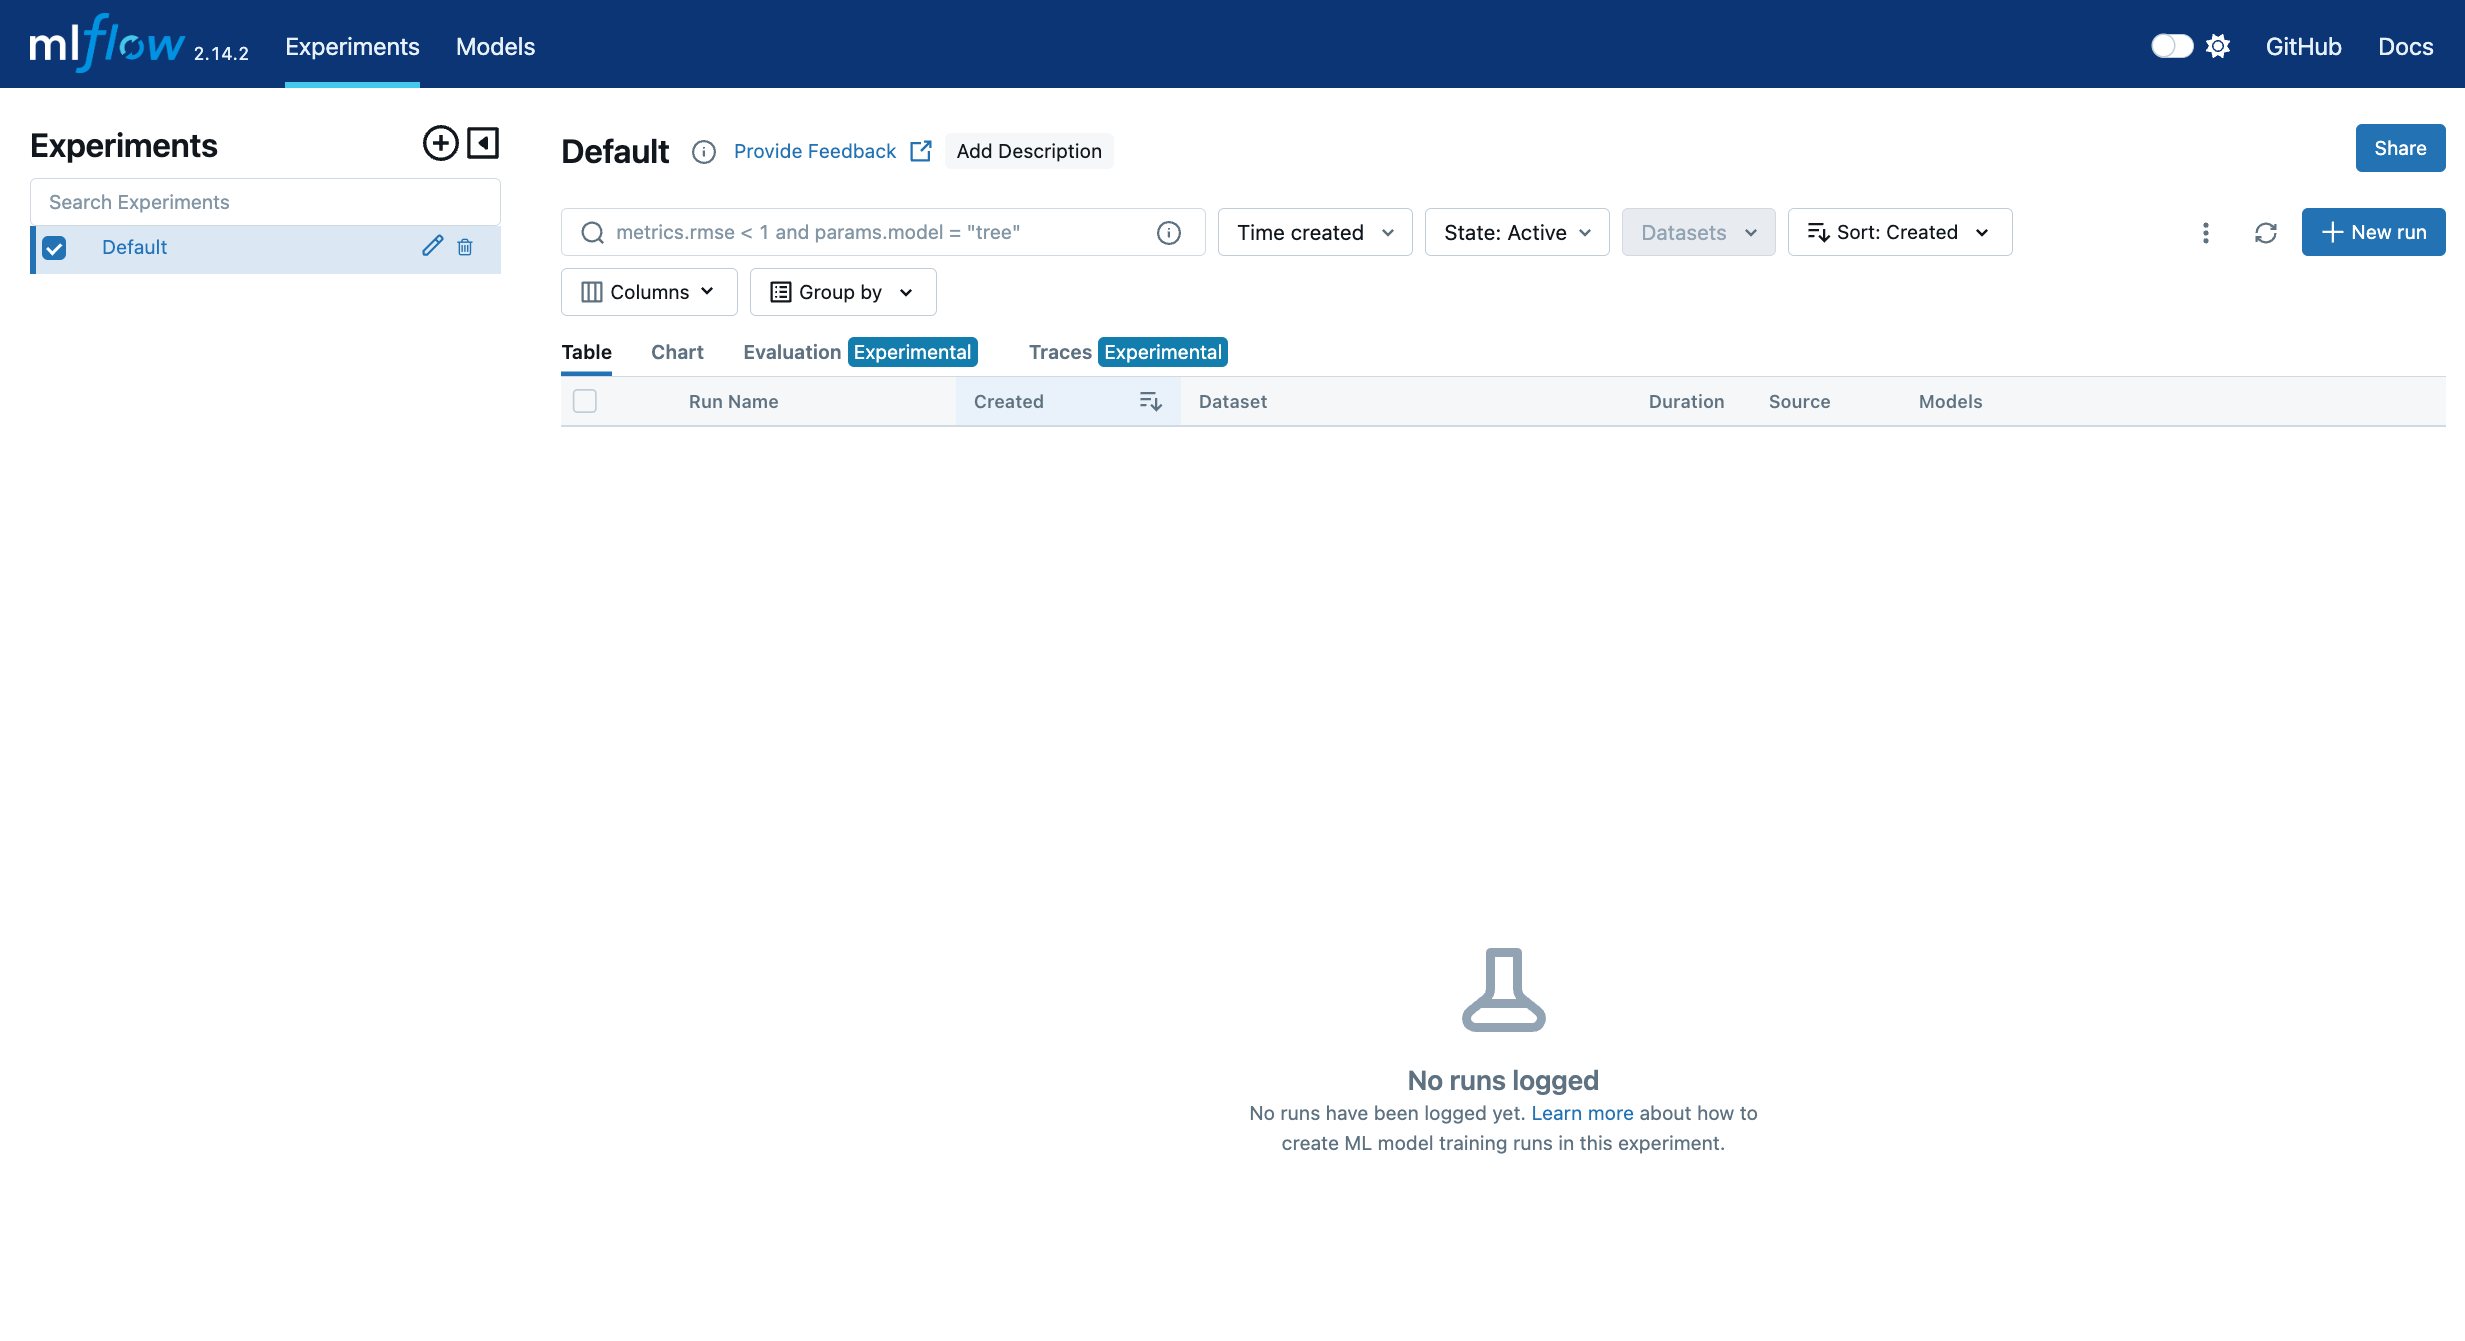
If you see a dashboard like the one below after logging in, congratulations! You’ve successfully set up the MLflow Tracking Server.
What’s Next?
We’ve now set up a Serverless MLflow Tracking Server in the GCP environment. In the next post, we’ll create a tutorial on how to experiment with parameters using MLflow+Optuna and build a UI that allows you to easily and intuitively analyze the results your image generation model produces.
keep going
Leave a comment